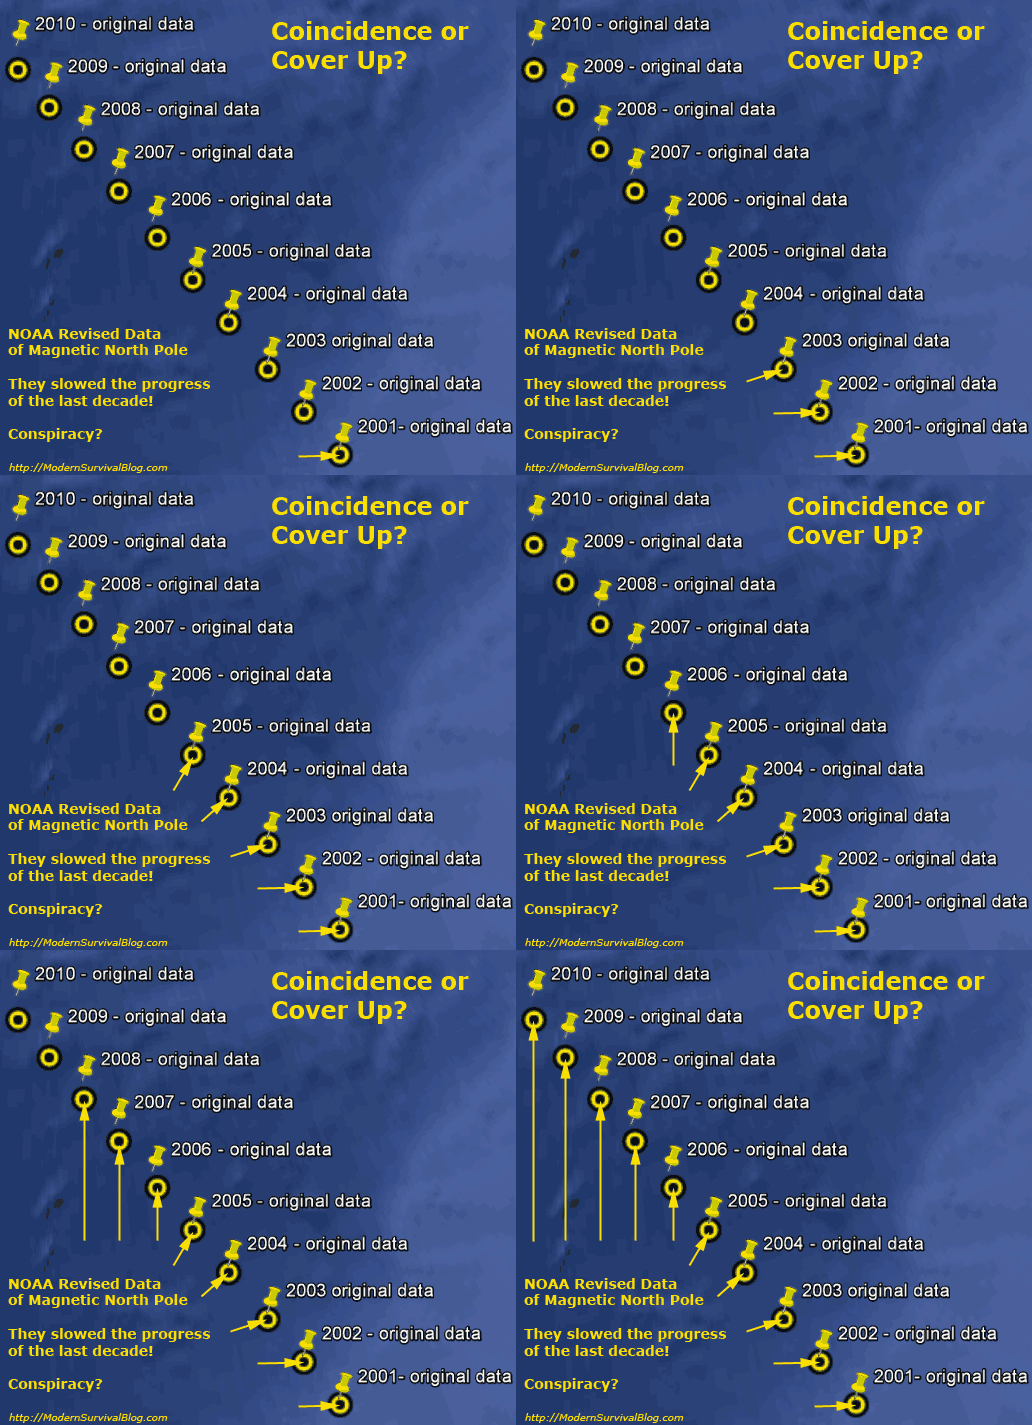
 The NOAA National Geophysical Data Center has updated (revised – massaged) their magnetic north pole-shift positional data and has projected the location of the pole through 2015. The pole shift, if you will, continues to race along in the same direction since it dramatically accelerated back in the mid 1990′s. But…
NOAA made some significant and apparently linear changes to the pole location data going back to the years 2001 through 2010. The most noticeable result of the changes that they made was an overall linear slow down of the shift during the past decade, although still currently high at 30 miles per year. They have projected positional data through 2015 and have slowed the pace of movement each subsequent year from 30 miles (2012) to 24 miles (2015).
No apparent reason for the change was listed. A 10 year change nonetheless! Given the fact that they suddenly changed their previously posted data of the previous decade to indicate a slower pole-shift progression, they are now able to project a slowing trend through 2015. If it were not for changing their own data, they would not have been able to project this trend through 2015. It is beginning to look like the USGS, who when they change their earthquake magnitude numbers, they always (95% of the time) revise them downward. The revisions made are always in a ‘less alarming’ direction.
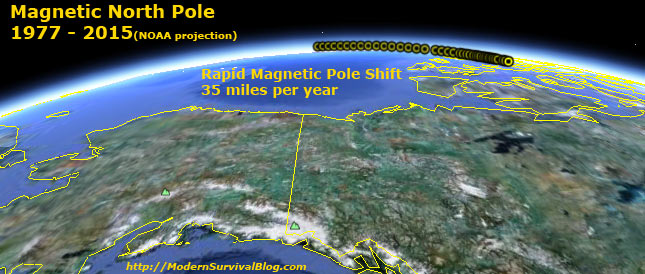
The following map shows the position of the magnetic north pole, and its shift since 1977. Read here for the past 400 years of magnetic north pole shift. Clearly it can be seen where the annual pole location begins to spread during the mid 1990′s when the acceleration rapidly increased.
The following image plot shows the comparison between the original magnetic north pole locations and now the new revised locations (2001 onward) from NOAA (National Oceanic and Atmospheric Administration).